
Page 40 - Energize August 2021
P. 40
TECHNICAL
density B S of 1,63T, which is small compared to silicon steel
(2,0 to 2,1 T). As a result, the cross-sectional area of an AM
core is about 1,3 times as large as that of SST with same power
capacity. This makes windings longer, with an increase in load
loss. However, the average load factor of many distribution
transformers is 30% to 50%, so the reduction of iron loss
outweighs an increase in copper loss. The additional copper
losses could result in the AMDT efficiency being equal to or
lower than CRGO efficiency at high loads (Figure 7). Table 3
provides figures for a typical manufacturer.
The other significant difference between amorphous core
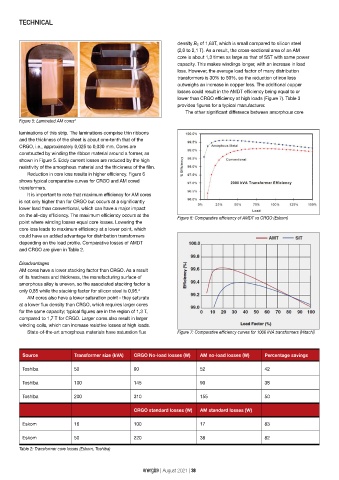
Figure 5: Laminated AM cores 4
laminations of this strip. The laminations comprise thin ribbons
and the thickness of the sheet is about one-tenth that of the
CRGO, i.e., approximately 0,025 to 0,030 mm. Cores are
constructed by winding the ribbon material around a former, as
shown in Figure 5. Eddy current losses are reduced by the high
resistivity of the amorphous material and the thickness of the film.
Reduction in core loss results in higher efficiency. Figure 6
shows typical comparative curves for CRGO and AM cored
transformers.
It is important to note that maximum efficiency for AM cores
is not only higher than for CRGO but occurs at a significantly
lower load than conventional, which can have a major impact
on the all-day efficiency. The maximum efficiency occurs at the
Figure 6: Comparative efficiency of AMDT vs CRGO (Eskom)
point where winding losses equal core losses. Lowering the
core loss leads to maximum efficiency at a lower point, which
could have an added advantage for distribution transformers
depending on the load profile. Comparative losses of AMDT
and CRGO are given in Table 2.
Disadvantages
AM cores have a lower stacking factor than CRGO. As a result
of its hardness and thickness, the manufacturing surface of
amorphous alloy is uneven, so the associated stacking factor is
only 0,85 while the stacking factor for silicon steel is 0,95. 3
AM cores also have a lower saturation point - they saturate
at a lower flux density than CRGO, which requires larger cores
for the same capacity; typical figures are in the region of 1,3 T,
compared to 1,7 T for CRGO. Larger cores also result in larger
winding coils, which can increase resistive losses at high loads.
State-of-the-art amorphous materials have saturation flux Figure 7: Comparative efficiency curves for 1000 kVA transformers (Hitachi)
Source Transformer size (kVA) CRGO No-load losses (W) AM no-load losses (W) Percentage savings
Toshiba 50 90 52 42
Toshiba 100 145 90 38
Toshiba 200 310 155 50
CRGO standard losses (W) AM standard losses (W)
Eskom 16 100 17 83
Eskom 50 220 38 82
Table 2: Transformer core losses (Eskom, Toshiba)
energize | August 2021 | 38