
Page 53 - Energize October 2021
P. 53
TECHNICAL
Figure 4: Ripple for each tap transition for all 3 phases
Figure 5
by the ‘ripple’, which expresses the maximum amount that the DC
current decreases as a percentage of the test current. The ripple is
normally plotted for all phases and taps as presented in Figure 4.
From Figure 4 the following is observed:
• The ripples of phases A and C practically overlap each other.
• The ripple is higher for Phase B and varies much more than the
ripples in phases A and C do, the latter which lend to nearly flat lines.
• The ripple graph from phase B may be different compared to the
graphs of phase A and/or C due to different induction.
In this case, the difference in ripples between phases combined with
the variance of ripples within Phase B indicate a problem for Phase B.
DRM analysis provides even more insight than comes from measuring
the ripple alone.
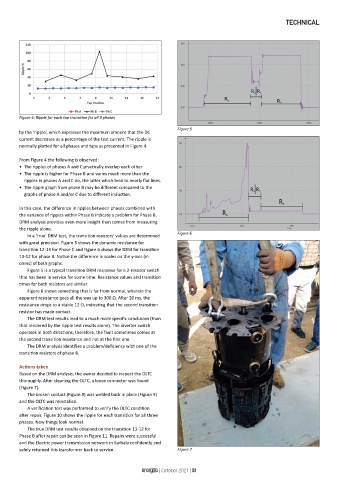
In a ‘true’ DRM test, the transition resistors’ values are determined Figure 6
with great precision. Figure 5 shows the dynamic resistance for
transition 12-13 for Phase C and Figure 6 shows the DRM for transition
13-12 for phase B. Notice the difference in scales on the y-axis (in
ohms) of both graphs.
Figure 5 is a typical transition DRM response for a 2-resistor switch
that has been in service for some time. Resistance values and transition
times for both resistors are similar.
Figure 6 shows something that is far from normal, wherein the
apparent resistance goes all the way up to 300 Ω. After 20 ms, the
resistance drops to a stable 12 Ω, indicating that the second transition
resistor has made contact.
The DRM test results lead to a much more specific conclusion (than
that rendered by the ripple test results alone). The diverter switch
operates in both directions; therefore, the fault sometimes comes at
the second transition resistance and not at the first one.
The DRM analysis identifies a problem/deficiency with one of the
transition resistors of phase B.
Actions taken
Based on the DRM analysis, the owner decided to inspect the OLTC
thoroughly. After cleaning the OLTC, a loose connector was found
(Figure 7).
The broken contact (Figure 8) was welded back in place (Figure 9)
and the OLTC was reinstalled.
A verification test was performed to verify the OLTC condition
after repair. Figure 10 shows the ripple for each transition for all three
phases. Now things look normal.
The true DRM test results obtained on the transition 13-12 for
Phase B after repair can be seen in Figure 11. Repairs were successful
and the Electric power transmission network in Karbala confidently and
safely returned this transformer back to service. Figure 7
energize | October 2021 | 51