
Page 52 - Energize August 2021
P. 52
TECHNICAL
Annual: This occurs when the annual wind
and solar patterns vary in a complementary
pattern. Studies have shown that this
situation does occur in some locations
and that long term cyclical variations in
weather patterns do occur (see Figure 4).
Where long term variations in resources are
supplementary rather than complementary,
problems could be encountered.
There has been an increased interest in
complementarity of RE resources in recent
years, judging by the large increase in Figure 4: Annual complementarity 3
1
published papers on the topic. The field
of study covers both specific projects or
locations as well as complete countries
or areas. Hand-in-hand with this is the
development of complex models and
tools used to analyse and describe
complementarity. An example is given in
Figure 5.
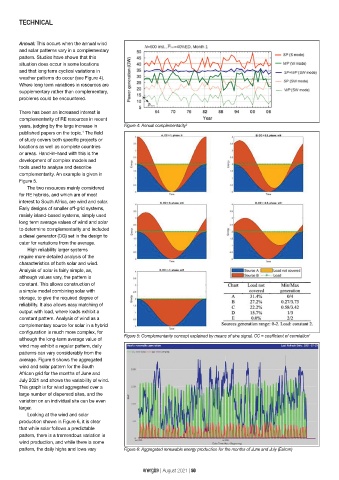
The two resources mainly considered
for RE hybrids, and which are of most
interest to South Africa, are wind and solar.
Early designs of smaller off-grid systems,
mainly island-based systems, simply used
long term average values of wind and solar
to determine complementarity and included
a diesel generator (DG) set in the design to
cater for variations from the average.
High reliability larger systems
require more detailed analysis of the
characteristics of both solar and wind.
Analysis of solar is fairly simple, as,
although values vary, the pattern is
constant. This allows construction of
a simple model combining solar with
storage, to give the required degree of
reliability. It also allows easy matching of
output with load, where loads exhibit a
constant pattern. Analysis of wind as a
complementary source for solar in a hybrid
configuration is much more complex, for
Figure 5: Complementarity concept explained by means of sine signal. CC = coefficient of correlation 1
although the long-term average value of
wind may exhibit a regular pattern, daily
patterns can vary considerably from the
average. Figure 6 shows the aggregated
wind and solar pattern for the South
African grid for the months of June and
July 2021 and shows the variability of wind.
This graph is for wind aggregated over a
large number of dispersed sites, and the
variation on an individual site can be even
larger.
Looking at the wind and solar
production shown in Figure 6, it is clear
that while solar follows a predictable
pattern, there is a tremendous variation in
wind production, and while there is some
pattern, the daily highs and lows vary Figure 6: Aggregated renewable energy production for the months of June and July (Eskom)
energize | August 2021 | 50