
Page 56 - Energize September 2021 HR
P. 56
TECHNICAL
Figure 4: Typical pump curves 3
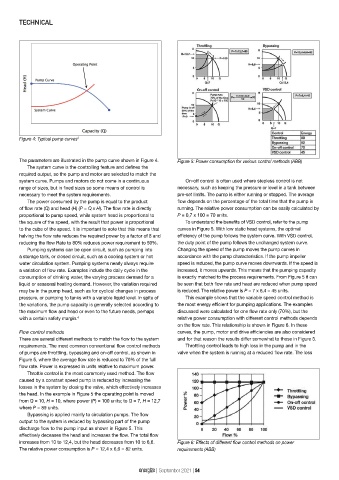
The parameters are illustrated in the pump curve shown in Figure 4. Figure 5: Power consumption for various control methods (ABB)
The system curve is the controlling feature and defines the
required output, so the pump and motor are selected to match the
system curve. Pumps and motors do not come in a continuous On-off control is often used where stepless control is not
range of sizes, but in fixed sizes so some means of control is necessary, such as keeping the pressure or level in a tank between
necessary to meet the system requirements. pre-set limits. The pump is either running or stopped. The average
The power consumed by the pump is equal to the product flow depends on the percentage of the total time that the pump is
of flow rate (Q) and head (H) (P = Q x H). The flow rate is directly running. The relative power consumption can be easily calculated by
proportional to pump speed, while system head is proportional to P = 0,7 x 100 = 70 units.
the square of the speed, with the result that power is proportional To understand the benefits of VSD control, refer to the pump
to the cube of the speed. It is important to note that this means that curves in Figure 5. With low static head systems, the optimal
halving the flow rate reduces the required power by a factor of 8 and efficiency of the pump follows the system curve. With VSD control,
reducing the flow Rate to 80% reduces power requirement to 50%. the duty point of the pump follows the unchanged system curve.
Pumping systems can be open circuit, such as pumping into Changing the speed of the pump moves the pump curves in
a storage tank, or closed circuit, such as a cooling system or hot accordance with the pump characteristics. If the pump impeller
water circulation system. Pumping systems nearly always require speed is reduced, the pump curve moves downwards. If the speed is
a variation of flow rate. Examples include the daily cycle in the increased, it moves upwards. This means that the pumping capacity
consumption of drinking water, the varying process demand for a is exactly matched to the process requirements. From Figure 5 it can
liquid or seasonal heating demand. However, the variation required be seen that both flow rate and head are reduced when pump speed
may be in the pump head, such as for cyclical changes in process is reduced. The relative power is P = 7 x 6,4 = 45 units.
pressure, or pumping to tanks with a variable liquid level. In spite of This example shows that the variable speed control method is
the variations, the pump capacity is generally selected according to the most energy efficient for pumping applications. The examples
the maximum flow and head or even to the future needs, perhaps discussed were calculated for one flow rate only (70%), but the
with a certain safety margin. 4 relative power consumption with different control methods depends
on the flow rate. This relationship is shown in Figure 6. In these
Flow control methods curves, the pump, motor and drive efficiencies are also considered
There are several different methods to match the flow to the system and for that reason the results differ somewhat to those in Figure 5.
requirements. The most common conventional flow control methods Throttling control leads to high loss in the pump and in the
of pumps are throttling, bypassing and on-off control, as shown in valve when the system is running at a reduced flow rate. The loss
Figure 5, where the average flow rate is reduced to 70% of the full
flow rate. Power is expressed in units relative to maximum power.
Throttle control is the most commonly used method. The flow
caused by a constant speed pump is reduced by increasing the
losses in the system by closing the valve, which effectively increases
the head. In the example in Figure 5 the operating point is moved
from Q = 10, H = 10, where power (P) = 100 units; to Q = 7, H = 12,7
where P = 89 units.
Bypassing is applied mainly to circulation pumps. The flow
output to the system is reduced by bypassing part of the pump
discharge flow to the pump input as shown in Figure 5. This
effectively deceases the head and increases the flow. The total flow
increases from 10 to 12,4, but the head decreases from 10 to 6,6. Figure 6: Effects of different flow control methods on power
The relative power consumption is P = 12,4 x 6,6 = 82 units. requirements (ABB)
energize | September 2021 | 54